

November 11, 2025 | Storytime | ~5min read time
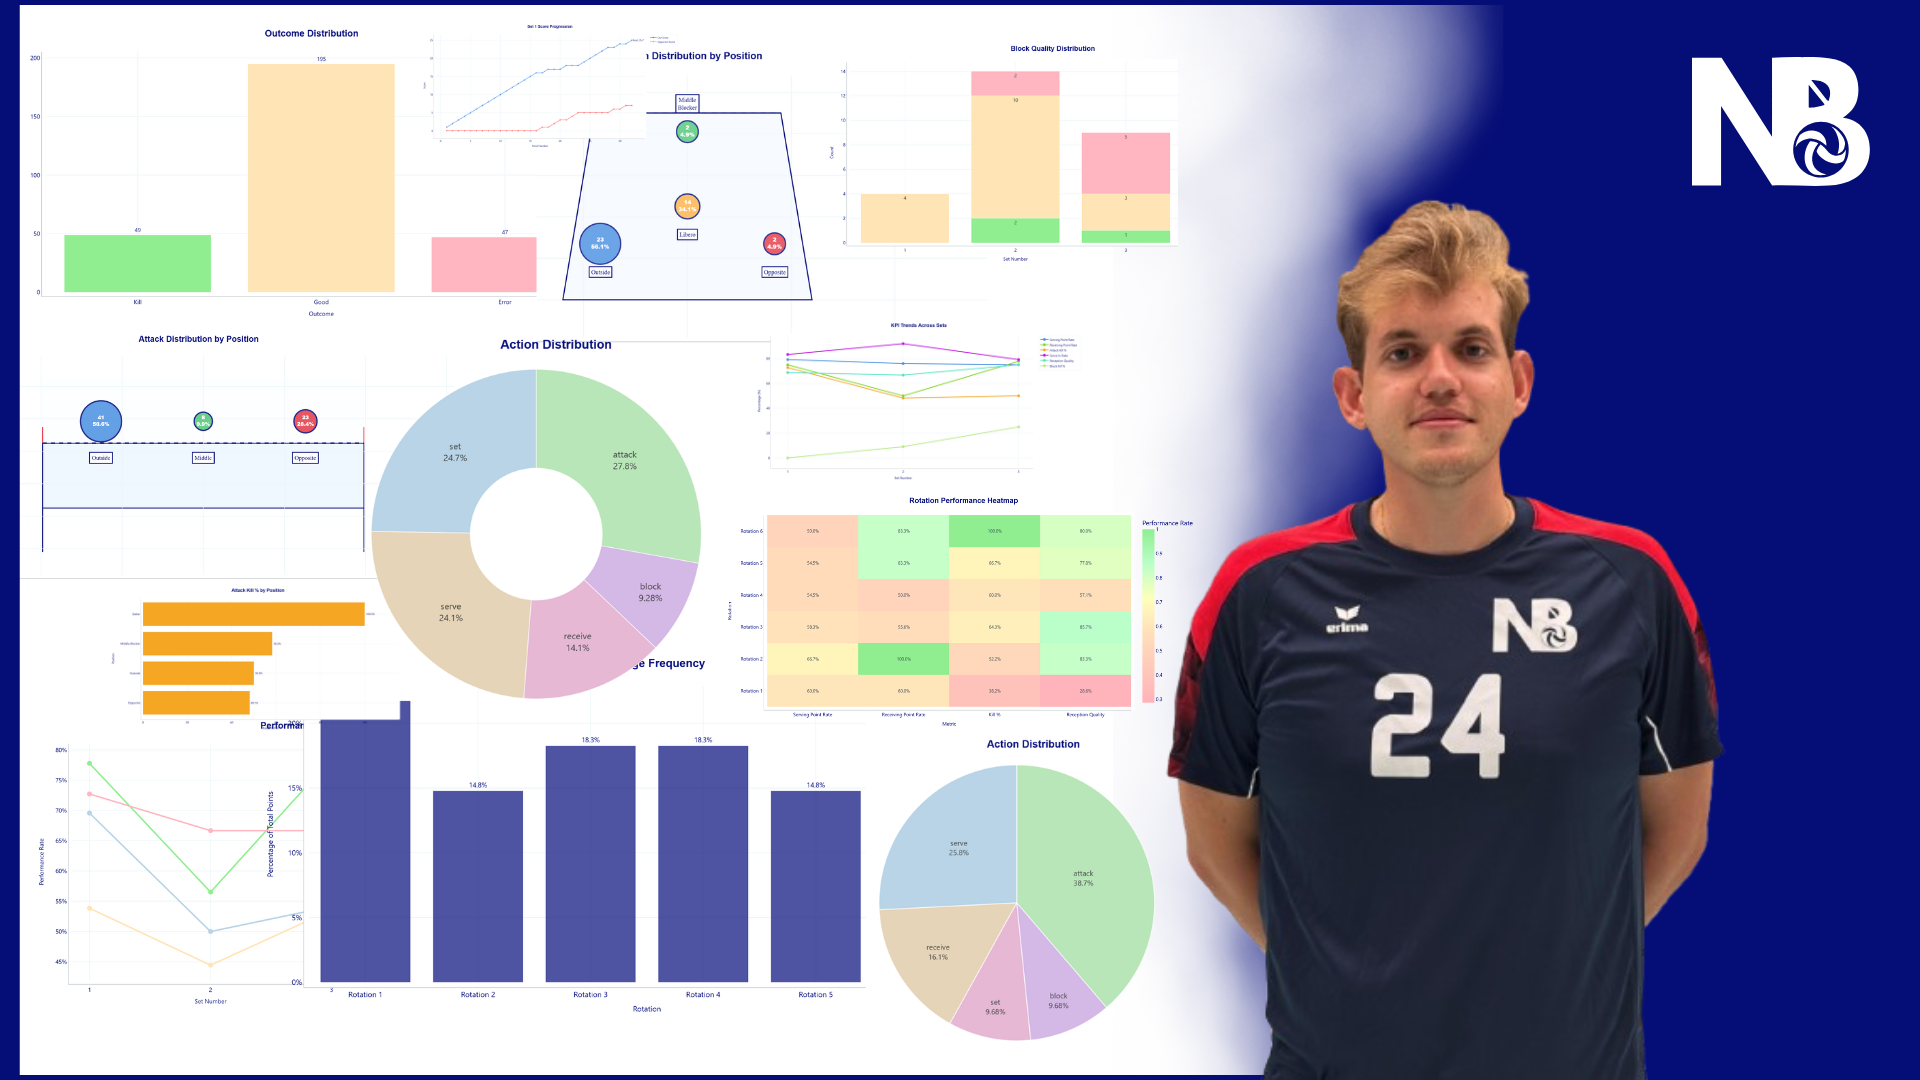
Everybody was impressed by the accuracy and visualisation of match data during the FIVB World Championships this year. So how do we collect data, how do we use it and what does it mean for the team?
Making data accessible
Data has become a staple in professional volleyball. We are used to impressive animations of ball in/ball out, reception accuracy visualisations and seeing what positions the setter trusts in the most to make a kill. As a club in Sporta IV our means are limited, but not our willpower and imagination. Of course we do not possess wearable sensors, high-frame cameras and powerful statistical software, but we got our very own data-wiz; Fabio.
He took it into his own hands to find a pragmatic solution to collect, process and visualise data about our matches. Fabio used open-source app framework Stream Lit and an AI tool to build our No Blockers dashboard infrastructure. The process involves the creation of Excel files designed to capture specific data from the games. This custom information is manually collected and then uploaded to generate the match data.
How we collect data about our players and our team
The system was designed to capture custom information about games, specifically details per player, such as attacks, kills, misses, sets, serve receptions, digs, and blocks. This level of detail allows for a comprehensive analysis of individual player performance.
Team performance is also a key aspect of the system, with data collected on points won when serving and receiving, as well as the length of rallies to determine if the team performs better with quick or longer points. The length of rallies is categorised into the number of hits, such as three, four, or five hits, providing insight into the team’s strategy and effectiveness.

Rendering insights in a dashboard
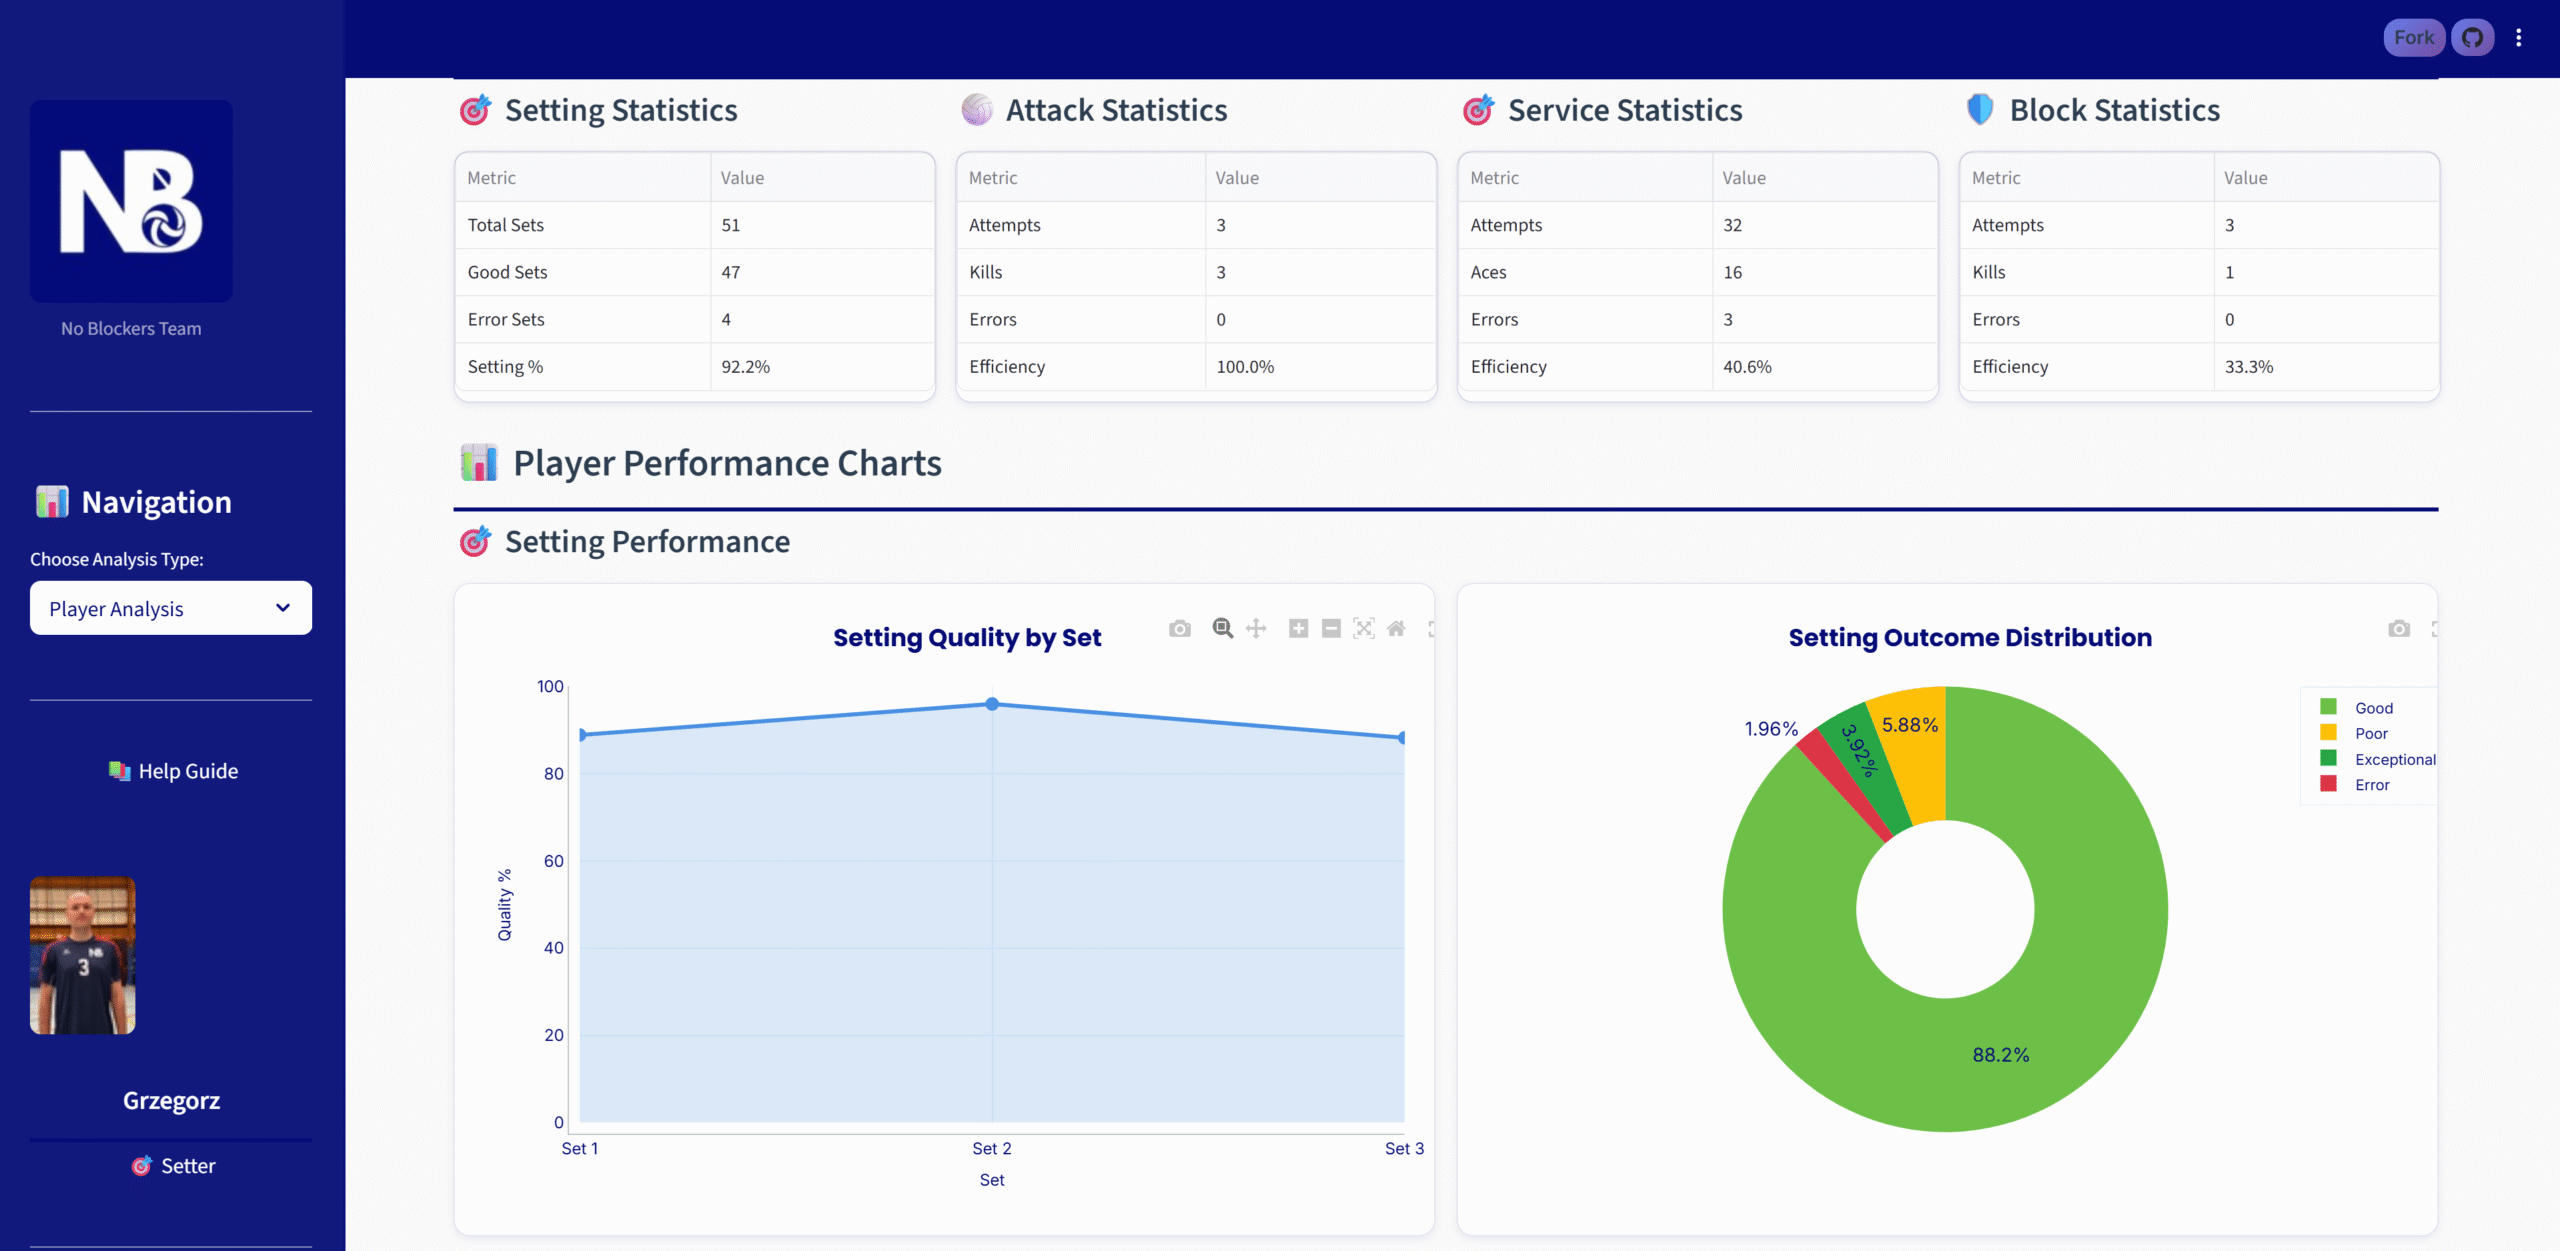
A backend code is used to clean the data and match it to the right formats for calculations, enabling the creation of graphs, numbers, and charts for each Key Performance Indicator (KPI). For every KPI, there is a calculation using the collected data, ensuring that the insights gained are accurate and reliable.
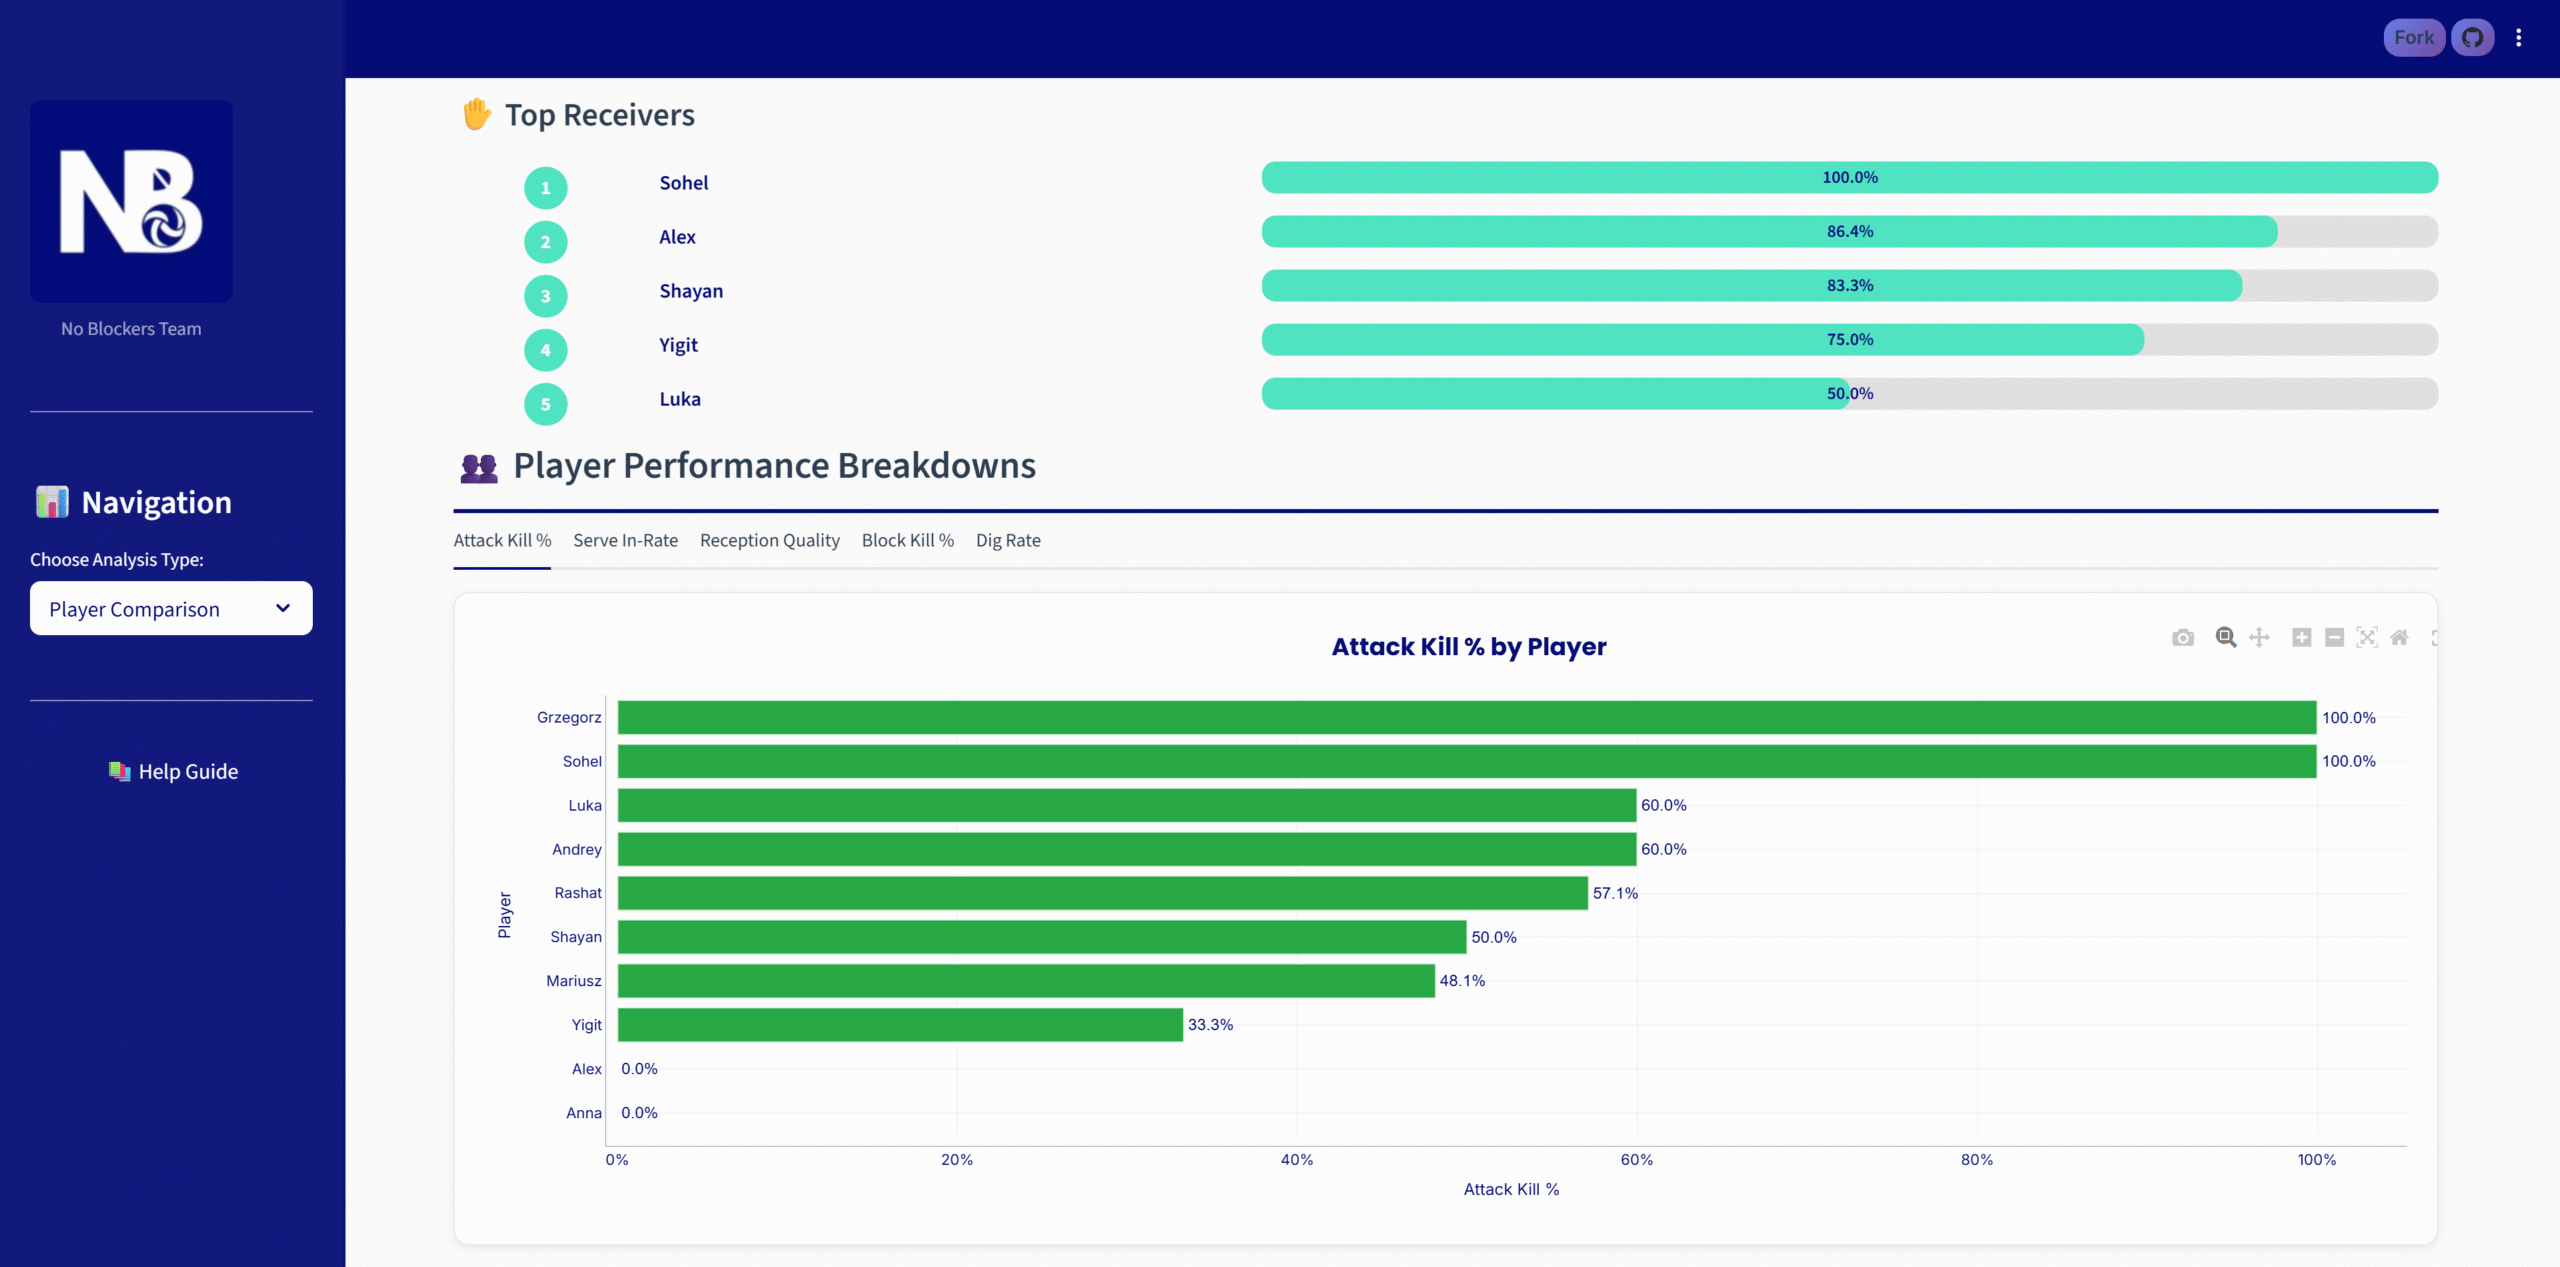
The dashboard is designed to be user-friendly, where all that is required is to upload the Excel file containing the manually captured game data. Once uploaded, the data is automatically populated, providing instant access to the analysed information.
Future development and use of the software
The system is currently in its first version, with plans to expand and improve KPIs and tracking methods as it evolves. We are also evaluating more granular and nuanced ways of collecting data. For example, when it comes to attack kills, there are several types of kills we could take into account: side out, attack in the net, attack blocked, easy attack, strong attack but defended and so on. We are also looking at possible speech recognition options for easier data collection. The ultimate goal is to gain deeper insights into the game, identifying areas where the team needs to focus its training. The system automatically suggests coach insights and recommendations based on the statistics it analyses, making it a valuable tool for strategic decision-making.
For more information, live stream and player interviews follow us on Instagram and TikTok!